Tuesday, April 26, 2016

Power BI Experiments

I’ve recently discovered Power BI. Basically, it’s the child of Power Pivot and SQL Reporting Services, but without Kryptonite to slow it down. You can connect to all kinds of datasources – Excel, SQL, Hadoop, folders ….and 55+ other data sources – and then perform analyses of the data therein. Microsoft has even allowed developers to publish / create new “visualizations” (charts, graphs, maps, etc.) for users to adopt for their data analysis.

I decided to give it a try, and used my Wine Cellar Excel spreadsheet as the test data set so I could more easily recognize any trends that the Visualizations pointed out.

I first evaluated my collection by Country & Region by Quantity of Wine (in ml). The light blue circles correspond to “France”, and the pink is “Portugal”…Somehow Burgundy, France wound up near New York…and our Douro, Portugal (Port!!) sat near the Great Lakes. This I cannot explain.. .I had to edit “Rhone, France” to “Lyon, France” to move it from somewhere in Asia to France. I’m not sure how it was handling the mapping, but I guess it cannot handle Region names.

The only way I could get the mapping to look better was to look up the regions and set them to specific cities in each country. I guess that the mapping program cannot understand Regions (Bordeaux, Burgundy, Cotes D’Or, Willamette Valley, Douro Valley, etc.). Therefore, if one wishes to use Power BI to display data on maps, then the locations listed must be City names, and not Region names, nor a mix of Cities and Regions as I had in my Wine List spreadsheet.

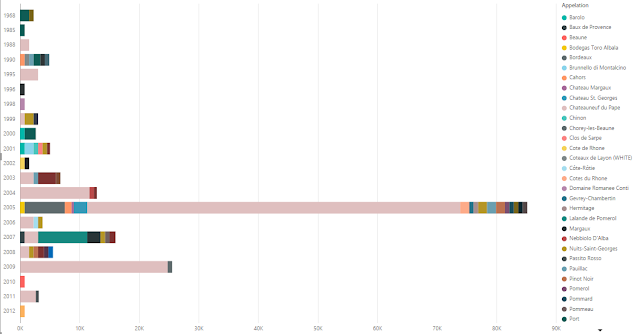
I then tried and analysis of Quantity (in ml) by Year and Appellation. This provided the expected results: we own a LOT of Chateauneuf du Pape 2005 (Pink in below graph).
I also evaluated it using the pie chart to see how that turned out.

Again, it’s obvious what we like to stock in our wine cellar (light blue is all 2005, and the majority is Chateauneuf du Pape), but it also shows that Power BI makes it extremely simple to illustrate that fact through the visualizations it provides - I spend only a few minutes to generate these charts from my data.

All in all, I’d say that Power BI is very useful for quick and efficient analysis of any dataset where a graph or chart would best illustrate the relationship of data elements within it.

Tuesday, April 19, 2016

Mutually INCLUSIVE Sets In SQL

SQL is your best friend when you need to find mutually exclusive sets of data – the more conditions you add to your query, the fewer records are returned. But how do you handle mutually INCLUSIVE sets where you want the content of each group to expand as more criteria are met?

 Most people when faced with a request such as that will respond similar to our Mikos (on the left) – with the “You want what? When?” look.

I had the person requesting this code twice demonstrate how he calculated the mutually inclusive set within Excel before taking on the project so I could be certain I understood the logic he was employing to calculate them.

The first demonstration included some “black magic”. During the second demonstration, I asked him to slow down and explain why he was doing what he did.

Terminology

Essentially, they had a many to many relationship between Project Milestones and Contracts for each Project and they needed to be able to accurately report the revenue for these items.
Normally, there’s a one-to-one or one-to-many relationship between Milestones and Contracts for Projects (at least in the software that I have worked with), so this was to handle the exceptional relationship so they could calculate Project costs and revenue appropriately.
Project – A project – like “build a house”
Project Milestone – Completion of certain tasks for a project – like Painting or Install Carpeting
Contract – the agreement between Customer & the subcontractor doing the work – the painter who also installs carpeting
Reporting Groups – Mutually inclusive sets related to the Milestone & Contract combinations – one reporting group contains all milestones for each Contract as well as all Contracts for each milestone

Algorithm

Determining the correct Reporting Group value is a multi-step process calculated over all Contracts and Milestones associated to the Project.
  1. Sort by Milestone
  2. Assign First-pass group value using DENSE_RANK() OVER (ORDER BY Milestone)
  3. Sort By Contract
  4. For each Contract with multiple Milestones, if the grouping values differ, assign all instances of the grouping value to the lowest value (Example: In Item 16, there are two Milestones. One has Grouping Value 4 & other has Grouping Value 6. Set all Grouping Value 6 instances = 4. Repeat for each Contract where a similar situation exists)
  5. Sort by Grouping Value
  6. Update Grouping Values so that any gaps in the sequence are closed (Example: Grouping Value 6 was removed in an earlier step, so all items with Grouping Value 7 become 6, then all the 8s become 7, etc. so that the Grouping Values are consecutive.)

Code

I found that the only way to reproduce the results was to loop through the data sets similar to the demonstrated method which includes suspiciously redundant code required to produce the “correct-according-to-the-customer” results.
The following may not be ideal SQL, but I found that it returned results exactly matching several examples provided by the Customer. Yes, the seemingly redundant updates are necessary because without them the final output does not match his final results. I have not found any alternative method to replicate the same results more efficiently.
Please note that I’ve simplified the content:
  • Only include what was directly relevant to the calculation of the mutually inclusive data sets
  • The sample dataset that is entered into the @ContractMilestones table is not nearly close to the 100+ line examples given to me
  • I have excluded any direct references to proprietary tables
Please note that the final insert has been commented out since the “FinalReportingGroups” table was not defined in the code, but it exists within the Customer’s database to store the Reporting Groups thus calculated. I’m sure that Readers of this post understand that they only need to view the final results of the calculations since updating the final table would depend upon their own personal database schema.)

    DECLARE @ContractMilestones TABLE (
        Co TINYINT
        ,Project VARCHAR(10)
        ,[Contract] VARCHAR(16)
        ,Milestone VARCHAR(20)
        )
       
INSERT @ContractMilestones (Co, Project, [Contract], Milestone)
VALUES
     ( 102,'Test', '5','493')
    ,( 102,'Test', '1.01','111')
    ,( 102,'Test', '1.01', '211')
    ,( 102,'Test', '1.01', '311')
    ,( 102,'Test', '2.02', '111')
    ,( 102,'Test', '3.01', '211')

    DECLARE @ReportingGroups TABLE (
        Co TINYINT
        ,Project VARCHAR(10)
        ,Milestone VARCHAR(20)
        ,[Contract] VARCHAR(16)
        ,MilestoneRptGroup INT
        ,ContractGrouping INT
        ,FinalGroup INT
        );

    WITH preranked (
        Co
        ,Project
        ,Milestone
        ,[Contract]
        ,MilestoneRptGroup
        )
    AS (
        SELECT Co
            ,Project
            ,Milestone
            ,[Contract]
            ,DENSE_RANK() OVER (
                PARTITION BY Co
                ,Project ORDER BY Co
                    ,Project
                    ,Milestone
                ) AS MilestoneRptGroup
        FROM @ContractMilestones
        )
        ,contractgroupd (
        Co
        ,Project
        ,Milestone
        ,[Contract]
        ,MilestoneRptGroup
        ,ContractGrouping
        )
    AS (
        SELECT Co
            ,Project
            ,Milestone
            ,[Contract]
            ,MilestoneRptGroup
            ,min(MilestoneRptGroup) OVER (
                PARTITION BY [Contract] ORDER BY [Contract] DESC
                ) AS ContractGrouping
        FROM preranked
        )
    INSERT @ReportingGroups (
        Co
        ,Project
        ,Milestone
        ,[Contract]
        ,MilestoneRptGroup
        ,ContractGrouping
        ,FinalGroup
        )
    SELECT Co
        ,Project
        ,Milestone
        ,[Contract]
        ,MilestoneRptGroup
        ,ContractGrouping
        ,DENSE_RANK() OVER (
            ORDER BY Co
                ,Project
                ,ContractGrouping
            ) AS FinalGroup
    FROM contractgroupd
    ORDER BY FinalGroup

    DECLARE @ItemGrouping INT
    DECLARE @MilestoneGroup TABLE (MilestoneRptGroup INT)
    DECLARE @ContractGroup TABLE (ContractRptGroup INT)

    SELECT @ItemGrouping = min(FinalGroup)
    FROM @ReportingGroups

    WHILE @ItemGrouping IS NOT NULL
    BEGIN
        INSERT @MilestoneGroup (MilestoneRptGroup)
        SELECT DISTINCT MilestoneRptGroup
        FROM @ReportingGroups
        WHERE FinalGroup = @ItemGrouping

        UPDATE @ReportingGroups
        SET FinalGroup = @ItemGrouping
            ,MilestoneRptGroup = @ItemGrouping
        WHERE MilestoneRptGroup IN (
                SELECT MilestoneRptGroup
                FROM @MilestoneGroup
                )

        DELETE
        FROM @MilestoneGroup

        INSERT @ContractGroup (ContractRptGroup)
        SELECT DISTINCT ContractGrouping
        FROM @ReportingGroups
        WHERE FinalGroup = @ItemGrouping

        UPDATE @ReportingGroups
        SET FinalGroup = @ItemGrouping
            ,ContractGrouping = @ItemGrouping
        WHERE ContractGrouping IN (
                SELECT ContractRptGroup
                FROM @ContractGroup
                )

        DELETE
        FROM @ContractGroup

        SELECT @ItemGrouping = min(FinalGroup)
        FROM @ReportingGroups
        WHERE FinalGroup > @ItemGrouping
    END;

-- This is the final table that holds the data we've retrieved
-- insert commented out so we can do a simple select.   
  --  INSERT FinalReportingGroups (
  --      Co
  --     ,Project
  --     ,[Contract]
  --     ,ReportingGroup
  --     ,Milestone
  --     )
    SELECT Co
        ,Project
        ,[Contract]
        ,DENSE_RANK() OVER (
            ORDER BY Co
                ,Project
                ,ContractGrouping
            ) AS ReportingGroup
        ,Milestone
    FROM @ReportingGroups
    ORDER BY Co
        ,Project
        ,[Contract]
        ,Milestone


Wednesday, November 13, 2013

Pivoting SQL Data for Instant Reporting

I always get a bit of geeky enjoyment out of finding an excuse to take advantage of features introduced into newer versions of SQL server. Today, a coworker asked me to help him pivot some data from an issue tracking table he was using. He didn’t know what “pivot” was, but that is what he wanted.
Here’s the table with sample data:
CREATE TABLE [dbo].[Issues](
    [Id] [int] IDENTITY(1,1) NOT NULL,
    [WorkItem] [nvarchar](50) NOT NULL,
    [DateSubmitted] [date] NOT NULL,
    [DateFixed] [date] NULL,
PRIMARY KEY CLUSTERED (
    [Id] ASC
)
)

INSERT [dbo].[Issues](
    [WorkItem],
    [DateSubmitted],
    [DateFixed]
)
VALUES
('Test', '20130310', '20130310'),
('Test1', '20130310', NULL),
('Test2', '20130311', '20130313'),
('Test3', '20130311', '20130311'),
('Test4', '20130311', '20130320'),
('Test5', '20130312', '20130314'),
('Test6', '20130314', '20130315'),
('Test7', '20130314', '20130315'),
('Test8', '20130316', '20130319'),
('Test9', '20130319', '20130330'),
('Test10', '20130320', NULL)

He asked me to go through the table, and for each day count how many issues were submitted and how many were fixed. When he manually counted the values, he got the following results:
Date Submitted Fixed
3/10/2013 2 1
3/11/2013 3 1
3/12/2013 1 0
3/13/2013 0 1
3/14/2013 2 1
3/15/2013 0 2
3/16/2013 1 0
3/19/2013 1 1
3/20/2013 1 1
3/30/2013 0 1
After staring at the tables for a few moments, I realized that the easiest way to transform the table into the results was to use PIVOT.
Select [Date]
, ISNULL([Submitted],0) as [Submitted]
, ISNULL([Fixed],0) as [Fixed]
FROM
  (Select DateFixed as [Date], COUNT(Id) as ct, 'Fixed' as md
     from dbo.[Issues]
    where DateFixed is not NULL
group by DateFixed
UNION ALL
   Select DateSubmitted as [Date], COUNT(Id) as ct, 'Submitted' as md
     from dbo.[Issues]
    where DateSubmitted is not NULL
group by DateSubmitted) as SourceTable
PIVOT
  (sum(ct)
   for md in ([Submitted], [Fixed])) as pvt
order by [Date]

And there you go. Fun day with new PIVOT-y toys.

Monday, September 30, 2013

Easy Trace File Query

Whenever a customer has an issue with slowness, we request a trace file to help us figure out where the problem may be. The trace allows us to see which procs are called most often, and which are taking up the most time.

I used to import the trace file into a temporary table, then run my own queries on the file to pinpoint issues. While that works well, it requires me to make additional copies of the customer's data which all has to be tracked due to in-house security rules. Since I don't like having to do excessive paperwork, I found a way to easily read in the data from where it sits rather than importing it into SQL server:

Select ObjectName
, substring(DatabaseName, 1, 18) as dbname
AVG(cpu) as cpuuse
, AVG(reads) as avgreads
, AVG(writes) as avgwrites
, COUNT(EndTime) as instances
, AVG(duration) as avgduration
, COUNT(EndTime) * AVG(reads) as cumexpense
from fn_trace_gettable ('C:\Temp\MyTraceFile.trc', DEFAULT)
group by ObjectName, substring(DatabaseName, 1, 18)
order by avgreads desc

The above query orders the items in the trace by average number of reads. Next, order the list by Average CPU then Average Duration. Any queries that are consistently at the top of the list are the first candidates for tuning.

I've also used the following to zero in on data regarding specific procs:

select  DatabaseName, ObjectName, TextData, CPU, Reads, Writes
from fn_trace_gettable ('C:\Temp\MyTraceFile.trc', DEFAULT)
where ObjectName ='MyStoredProc' or ObjectName='YourStoredProc'

Have fun analyzing your trace files.

Wednesday, October 31, 2012

Preparing for SQL Pass Summit–Part the Last

It’s the week before SQL Pass, and I hope everyone feels they’re ready to go. It’s time to pack your stuff, iron your kilts, and get your travel documents organized – we’ll be seeing you soon. This will be the final Pre-Summit blog post to wrap up the series for the "Summit First-Timers" program. This is the sixth posting in the series. Here are the links for Part 1, Part 2, Part 3, Part 4, and Part 5.

Last minute TO-DO list

Check your flights

If you’re flying into Seattle, this is a must – especially if your flight has a stop in or departs from any of the Airports that were in Hurricane Sandy’s path. The storm made a total mess of the eastern half of the US, some airports may still be under water or out of commission, and your flight plans may have to be changed. In addition, since about 20,000 flights into and out of the area were canceled earlier in the week, expect security lines to be extra long and airports to be especially crowded as stranded travelers seek seats on upcoming flights.

Check the Weather

People always ask me, “Will it rain during SQL Pass?”. Probably. According to Weather.com’s 10-day forecast for Seattle, expect rain showers on a couple of the days during the week, and clouds the other days. Temperatures will range from the low 40s at night, to the upper 50s during the day. Another weather site, Wunderground, predicts a slightly more sunny week. Bring a raincoat just in case the first one is right – you never know when it comes to weather.

Print relevant travel documents

Print out your hotel reservation information, flight itinerary, boarding passes, and your SQL PASS Summit receipt, Visit your favorite online mapping site – google maps, mapquest, or yahoo maps – and print out the appropriate maps showing the location of your hotel, the convention center, and other sites you’re planning to visit while in Seattle. I know some will say, “I’ve got a GPS application on my phone to handle all that”, but what if your phone’s battery runs out while you’re traveling, and you can’t use it? Paper doesn’t require batteries. 

Download Reading Material

If you are bringing a eBook reader (Kindle, Nook, Tablet with eBook reader application) for the flight or train trip to Seattle, be sure you have downloaded several books before leaving home – you can’t rely on being able to find free wifi to load you eBook while traveling, and there’s nothing like opening your Kindle application only to see 0 books available.

Pick Songs to Sing at SQLKaRAOKE

SQL Karaoke - singing best left in the showerJen McCown reminded me via twitter of this very important Pre-SQLPASS step:
If you are planning to participate in Karaoke on any of the evenings of SQL PASS (some attendees go every evening – just ask around), you should pick out a handful of songs that you’d like to sing so that when it’s your turn at the microphone you’ll be ready to rock. Practicing songs in the shower is strongly advised.

Pack your SQL Kilt and SQL-Saturday Shirts

Wednesday of SQL PASS Summit is “wear your SQL Saturday shirt” day so if you haveJean & Sean Showing off their SQLKilts one be sure that you remember to pack it.
Thursday is SQL Kilt day. Yes, both men and women don kilts on the day of the WIT Luncheon to help celebrate and support Women in Technology. SQLKilt day is a tradition that started several years ago when a bunch of SQL MVPs decided to show up at SQL PASS wearing kilts, and over the years more and more people have joined in on the fun.
If you don’t already have a kilt, don’t worry, Utilikilts is on 1st Avenue in Seattle, which is just a short walk from the Convention Center, and you should be able to pick one up there shortly after you arrive.

Watch the First-Timers Webcast Recording

If you weren’t able to view Denny Cherry’s live webcast for SQL PASS Summit First-Timers, he has uploaded it to the Live Meeting website for you to view. Simply go to the Live Meeting site which is setup for this recording and put in your name. It will also ask you for a recording key, just leave that blank as there is no key for this recording. On the next screen it'll ask you for your email address and company then you'll be able to view the recording. The entire video is posted online including all of the Q&A.

Make arrangements for Pets and Mail

nom nom nomIf you live alone, don’t forget to tell the post office to hold your mail so that the mailbox won’t be overflowing when you return.
If you have pets, be certain that you’ve arranged to have someone visit your home every day to provide food and water for them. And be sure to give your beasties a little extra loving before you leave. They’ll miss you.

Well, that about covers it. See you at SQL Pass Summit!
Saturday, October 27, 2012

Vieux Télégraphe Châteauneuf-du-Pape Tasting

Last Friday, October 19, 2012, my husband and I had the privilege of meeting DanielIMG-20121019-00013 Brunier, Winemaker for  Vieux Télégraphe Châteauneuf-du-Pape , at Liner and Elsen, a neighborhood wine shop in Portland, Oregon. We tasted 8 wines that M. Brunier produces. It was a LOVELY evening and a fantastic opportunity to enjoy our favorite wines along with a crowd of others who also greatly appreciated this kind of wine. The following are the tasting notes my husband recorded.

The prices shown are what Liner and Elsen listed on the tasting notes sheet that each attendee was given.

We score the wines from 0 to 10. NO WINE has ever received a score of 10 from us (we’re tough when it comes to rating). Anything above a 6 is excellent. Our cellar is full of mostly Vieux Telegraphe Chateauneuf-du-Pape so you know we LOVE this winemaker.

2011 Les Pallieres Gigondas rose, "au petit bonheur"

($21.99 bottle/225.61 case)
- Grenache , Syrah , Cinsault , Clairette
- Crisp, lighly sparkling, bone dry
- score: 9

2010  Vieux Télégraphe Châteauneuf-du-Pape blanc

(bottle 66.99/ case 687.31)
- Clairette (40%), Grenache Blanc (30%), Bourboulenc (15%) and Roussane (15%)
- Clear and clean
- light acidity
- Nothing special (but nothing really wrong)
- Score: 7

2010 Brunier Le Pigeoulet en Provence, Vin de Pays de Vaucluse rouge

(bottle 17.99/ case 184.57)
- Coppery finish almost cheaper pinot-like. Good pizza wine
- Grenache Noir (80%), Syrah (10%), Carignan (5%), Cinsault (5%)
- score: 8

2008 Pallieres Gigondas, Terrasse du Diable

(bottle 31.99/ case 328.21. 1.5l 74.99)
- Young with a shorter finish than Vieux Télégraphe
- Pepper, cherry, tobacco
- Grenache Noir (90%),Mourvèdre (5%), Clairette (5%)
- score: 8

2009 Telegramme Châteauneuf-du-Pape rouge

(bottle 45.99/ case 471.85)
- mostly Grenache
- Tight, alum chalky
- light black cherry
- Score: 8

IMG-20121019-000122009  Vieux Télégraphe Châteauneuf-du-Pape rouge

(bottle 66.99/case $687.31; 1.5l $161.99; 3l $368; 6l $698; 9l $1028)
- Grenache Noir (65%), Mourvèdre (15%), Syrah (15%); Cinsault, Clairette and sundry others (5%)
- Very green and tight
- tasty; classic CNdP
- Score: 8

2010  Vieux Télégraphe Châteauneuf-du-Pape rouge

(bottle $82.99/case 851.47; 1.5l $185; 3l $458)
- Grenache Noir (65%), Mourvèdre (15%), Syrah (15%); Cinsault, Clairette and sundry others (5%)
- Much more approchable than the 2009
-  tasty; classic CNdP
- Score: 9

Wine Spectator Interview with Daniel Brunier in 2007:

Tuesday, October 23, 2012

Preparing for SQL PASS-Part 5

Since I've attended SQL Pass Summit a couple of times, this year I volunteered to help out with the "Summit First-Timers" program. This program is designed specifically to help people who are attending SQL Pass Summit for the first time to get the most out of their experience at Summit. I've decided to post a series of blog entries here to not only help out my flock of first-timers, but to also ensure that the information is shared with as many other first-time (and alumni) attendees as possible. This is the Fifth posting in the series. Here are the links for Part 1, Part 2 Part 3, and Part 4.

I hope most of you watched Denny Cherry's "SQL PASS First-Timers" webcast. I attended it and discovered that they have already moved the location of the breakfast & lunch room from its traditional location in cozy little 4B to the cavernous 4E-F. Check out the map to see the conference center layout. The 4th and 6th floor are where most of the activities will be held.

First-Timers Networking Sessions

On Tuesday afternoon, there are several 45-minute networking sessions led by Don Gabor. These are exclusively for First-timers and are invite only. All first-timers should have received an email with links to RSVP to the session of their choice. If you are a first-timer and have not received the email, please contact PASS, and let them know. Any sessions not filled before the end of this week will be opened to other attendees.

First-Timers' Orientation

Lady Runa's Flock
Tuesday evening, at 5:15 is the First-Timers' Orientation. This is where First-Timers will first meet their alumni Mentor. If I am your Alumni Mentor, you'll receive a sticker of the graphic to the left of this paragraph to put on your badge to make it easier for you to identify the other "official" members of my flock. If you aren't part of my flock, I hope that the person who is your mentor has his own set of stickers to brand his herd with. (I printed twice as many stickers as I need, so if you REALLY want to be a part of the flock, I can be bribed convinced to give you one). Further details about this event, and the schedule from there will be available later - generally speaking, shortly after the orientation, we'll be heading down to the Welcome Reception.

Don't forget to bring along business cards to hand out to people you meet!

Homework

Thought I'd let you off easy, eh? Well, since SQL PASS Summit is only 2 weeks away, I have homework for you to do:

  • Ensure you have a login for SQL PASS (free registration link here).
  • Log in to the Schedule Builder and select sessions you wish to attend*. If you're having difficulty choosing sessions to attend, you may consider following the advice from the Expert Picks provided by PASS Virtual Chapter leaders and community Experts.
  • If you will be present in Seattle on Monday and/or Tuesday, consider signing up for one of the pre-conference sessions. These are full day in-depth sessions that are well worth the additional $395 each to attend.
*PASS uses the data from the Schedule Builder to plan session room sizes - the most popular sessions are moved to larger rooms, and less popular sessions to smaller ones - ensuring that the sessions you want to attend will have enough room available for you to squeeze in.

How to Turn Off Smart Charging

After a recent update, I discovered that my battery was down to 80% while plugged in, which I hadn't expected to see. I also noticed tha...