Tuesday, April 10, 2018

TSQL2SDAY 101: Essential SQL Server Tools

I've decided to jump onto the bandwagon and submit and article for this T-SQL Tuesday. This month, Jens Vestergaard (b|t) is hosting, and he's asked us to post about "The Essential SQL Server Tools in my Stack". These are the tools in addition to SSMS and Visual Studio Data Tools which we use for every day SQL activities.

In case you're new to T-SQL Tuesday, it is a blogging party hosted by a different person each month. It’s a creation of Adam Machanic (b|l|t), and it’s been going on for a very long time - we're currently on #101.

LadyRuna's Essential SQL Server Tools

As a consultant, I am often in the situation where I cannot make changes to the system I am using, so I frequently have to work with whatever they provide. Sometimes I'm lucky and they provide a few of my favorite tools, and other times not so much. Therefore, the tools I'm listing are the ones most frequently available to me in my consulting gigs.

Notepad ++


I hear you laughing, but think about it: you're tasked to create an SSIS package to import a flat file into your SQL server. Before you do anything in SSIS, you have to look a the file so you know whether the package will require any data transformations prior to loading the content into the SQL table.

If you open the file in Excel, it may automatically change the data types incorrectly (a good example is changing an account number that begins with 00 to an integer. That action removes the leading zeros, essentially modifying the account number's value), or it may reformat values in an undesirable format (changing phone number to scientific notation). If you open it in Notepad++, you will see exactly what the source system output and you will be able to accurately map all of the data correctly the first time. 

Notepad++ also offers context highlighting for various programming languages, a spell-checker, and prompts for frequently typed words (the list seems to grow the more you use it). Notepad++ highlights pairs of parenthesis, brackets, and braces; toggles comments; gracefully handles indents; and has fantastic searching capabilities. I like it enough that I find I use Notepad++ more than SSMS for many coding activities.

Poor Man's T-SQL Formatter


This is a free open-source downloadable T-SQL formatter available for SSMS, Visual Studio, and Notepad++ . It provides enough formatting options to satisfy most of the T-SQL formatting standards I've seen. If you haven't tried it yet, please download it and see for yourself.

Poor Man's SQL Formatter in Notepad++

Poor SQL


This is a free, online SQL formatter. Since there is nothing to download or install, I use this to format my SQL when I'm working in an environment where I don't have access to any other formatter and I want my code to be formatted consistently and / or in compliance with the customer's style. I have not yet encountered a situation where this option was blocked.

Task Factory


Some of the Task Factory Components
Until I started working for Pragmatic Works, I'd never used Task Factory when developing SSIS packages, but now that I do, I've found it actually makes working with SSIS pleasant.

Task Factory has over 60 SSIS components which are optimized to run faster than the native SSIS components. The Task Factory components handle many tasks which previously could only be handled using custom script components - allowing users to avoid the nightmare of debugging and rewriting script components for different environments.

BI xPress


Yet another Pragmatic Works product that I wish I knew about years ago is BI xPress. It includes auditing and notification frameworks which can easily be applied to any SSIS package to provide consistent and efficient auditing of SSIS package runs.

Once the auditing framework has been applied to a package, the SSIS Monitoring shows details about each run - including the values of variables at each component and, if the package is still running, which step it is currently running. I've found it's great for debugging packages that "worked on my machine" but aren't working properly in the SSISDB. I can see everything about the package in the SSIS Monitor in a view similar to what I'd see when running the package in Visual Studio.

There are more features to BI xPress than that, but in my experience those features are the ones I go to most often.


DOC xPress


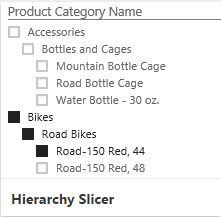
One more Pragmatic Works product I wish the companies I worked for years ago had is DOC xPress. Its main function is to create documentation of SQL Server, SSAS, SSIS, SSRS, Excel, Oracle, and other database-based systems. It does this by pulling metadata about each of the objects and compiling it into a single cohesive unit. The documentation can be output into CHM help file, HTML, RTF or Word Documents.

I've found this is a fantastic device for learning about a new database system because all of the information is available in one spot. If a change occurs on a database that has been documented, after taking a new snapshot, the "before" version of the database can be compared to the "current" version to see what has changed.

DOC xPress even has a "lineage" feature which allows users to answer the question "Where did this field originate?". This means you can potentially pick a field in a table in the SSAS cube, find the SSIS package that loaded the cube, and trace that field back to the source database where it originated. Tracing the "lineage" with this tool is many times more efficient than the old fashioned method of getting a pre-dawn phone call about a process failure because someone made a change and didn't find all of the downstream effects of that change.


Tuesday, April 3, 2018

Power BI: M Query Basics (Part 1)

When you work with Power BI, you'll find that there are two languages to work with: DAX and M. Since most of the M query that you will regularly use is automagically (*that's not a real word, but it SHOULD be one) written by the Power BI user interface, the majority of Power BI developers focus on becoming proficient in DAX and really only look at M when they're stuck in a situation that requires that they learn it.

This M&M is a mashup of chocolate
 and pretzels
So, what exactly is M?

Some people think M is for "Microsoft".

Not quite.

According to the Microsoft Power Query M Reference,  "The Power Query M formula language is optimized for building highly flexible data mashup queries. It's a functional, case sensitive language similar to F#."

Generally speaking, most Power BI professionals settle upon saying that M is for 'Mashup'.

Now, when I heard that, the first thing I thought of was the orange pretzel M&M guy - he's a mashup of a favorite chocolate candy with pretzel and maybe some other stuff. Quite enjoyable, but not your standard or traditional M&M - just like M Query.

M is a functional script language with a step by step language structure used for data preparation. With it, one can transform or combine data sets, pivot, unpivot, split columns,  add or remove columns, remove unwanted characters, modify data types and perform data manipulations, among other things.

In Power BI, M Query can be automagically generated within its Query Editor user interface. The "Applied Steps" listing there summarizes all of the sequential M Query steps that have been applied to the current query, allowing users who aren't proficient in M Query to quickly view the changes made to the data set and to modify the changes without intimate knowledge of the M Query syntax.

Let's take a look at the structure of an M Query. You can access the M Query code from the Query Editor in Power BI by clicking on "Advanced Editor".

Here is an example of a Power BI M Query:

In Dark Blue, we have the "let" expression. This is equivalent to our SQL "CREATE PROCEDURE" declaration - it demarks the beginning of the series of steps used to transform the data into the final table to be used in Power BI.

Next, in Purple, we have the "in" expression. The Named Expression which follows "in" is the Output or final result of our M query. This defines the values that are seen in the grid view within the query editor.

In Aqua, we have the Named Expressions and variables. Each Step is a Named Expression which functions as a label to identify that step. Steps that are a single word may be declared by simply using the word alone, however, step names which contain spaces must be marked by using # and then enclosing the words within ". An example would be #"Renamed Columns"... Note that Source, which is only one word, does not need either the # or the " surrounding it.

In Green, we have the M Functions. These are the transformations performed upon the data set and the commands used to shape or mashup the data as needed by the final Power BI report.

In Black are the references to the previous steps. If you check each line, you will see that the Previous Step reference (in black) exactly matches the Named Expression (in Aqua) in the line above it. This helps demonstrate the step by step nature of the language - each successive step references and builds upon prior steps.

 There are a few other types within the M Query syntax, such as strings in Brick Red, data types and key words, but generally speaking the above summarizes the M Query syntax.

Thursday, March 1, 2018

SQL Saturday Phoenix - 17 March 2018


Just wanted to say that I'll be speaking at SQL Saturday Phoenix on 17 March 2018 on "Power BI: The Magic of M."  My presentation with be in the first set of sessions (10 AM), so be sure to arrive early! I'll be debuting my super special (yellow & black) "Power BI" dress, too.

The abstract is:

Power BI: The Magic of M

As the popularity of Power BI increases, knowledge of M, the language used in Power Query and queries in Power BI, is becoming more necessary. Although the Query Editor in Power BI generates most of the M needed for basic transformations, it's just the beginning of its capabilities. In this session we will look under the hood at the M query and demonstrate some of the magic of this powerful language.


SQL Saturday Phoenix will be held at Grand Canyon University, 3300 West Camelback Road, Phoenix, Arizona, 85017, United States

Monday, February 19, 2018

T-SQL Tuesday #99 - A Passion for Sewing

This post is part of T-SQL Tuesday, a monthly blog party on the second Tuesday of each month which was started back in 2009. This month's host is Aaron Bertrand (B|T), who presented us with a choice between two possible topics - something non-technical you're passionate about or t-SQL bad habits. I know I'm a week late, but I didn't see the topic notification until today, so I thought I'd create a post anyway because I needed to resurrect my blog and this post was a good excuse for reviving it.
Honor Harrington

My passion outside of the SQL server community
is sewing. Much of my earlier sewing was costumes for myself which I'd wear to Science Fiction, Anime, and Steampunk conventions. Over the years, I've entered - and won - numerous costuming awards at the conventions for my creations.
Katamari!
Sesshoumaru

I soon realized that the reason I preferred wearing costumes wasn't simply because they were unusual garments but because they fit much better than the clothing I could purchase at stores. This led me
Neo and Trinity
down the road of making nearly every garment I have in my closet. I've made some shirts for my husband, sewn curtains for the house, recovered the sofa cushions, made pillows, sewn purses and totes, and made quilts.
Pumpkin Scissors
SQL Cruise formal dress


I also collect antique and modern sewing machines. Currently I have 15 machines, including a 15-needle embroidery machine. Sewing is rather addictive - once you find out how easy it is, you can let your creativity fly and make anything you desire.
Redline 1501
Singer 201
Willcox & Gibbs

Wednesday, May 31, 2017

Unblocking blocked files

I recently stumbled across a somewhat frustrating feature of Windows 10. With the intent of protecting users from viruses and other malware, any file you download from another computer is by default 'blocked'. The standard way to unblock a file is to right-click on the file you downloaded and check the box next to "Unblock".


This method works great for individual files that you download. However, when a coworker sent me a zip file containing a multi-project Visual Studio Solution via Skype, I discovered that it would extract fewer than a third of the files from the zip file. The extractor would refuse to extract any of the Powershell scripts, BAT files or EXE files contained within the zip file. Since the zip file contained over 1000 files, unblocking them manually would be a trying experience. I needed a neat solution to iterate through all files in the zip and unblock them all.

Powershell came to the rescue. Simply start Powershell as Administrator and enter the following command:

get-childitem "C:\FullFilePathName" -recurse | unblock-file

where C:\FullFilePathName is the full file path name for the zip file you want to unblock.

After running the above command, I was able to extract all of the files and run the Visual Studio solution without issues.

PS: please only use this solution when you know that you can trust the source of the files. 

Friday, June 24, 2016

Power BI: Custom Visuals - Hierarchy Slicer

I've been playing with PowerBI recently and have discovered their Gallery of Custom Visuals. I decided to try a few to see what they do and determine whether they'd be useful in future PowerBI projects.

Previously, I tested the "Meme generator" (Note: this visualization has been removed temporarily from the PowerBI website, but should reappear shortly). This time, I've chosen one that I hope to be useful to PowerBI users.

The Hierarchy Slicer is available from the PowerBI Gallery of Custom Visuals. Click on its icon to open up the Description and Download dialog. This dialog also offers the option to download a sample PowerBI file that demonstrates the use of the visual.


Testing

After examining the sample file, I decided to experiment with the new visual on my own.

As with all custom visuals, when you open a new PowerBI report, the custom visual is not automatically available in the visuals list. To make it available you must first import it into the Visualizations bar by clicking on the " . . . " icon.

PowerBI will pop up a warning that you're attempting to load a custom visual and that you should only open it if you trust its author and source.
 Click on Import to open a dialog to browse for the custom visual you just downloaded. It should be named, "HierarchySlicer.0.6.0.pbiviz" (or similar - they may have updated it since I downloaded it) and it should be located in the directory where you normally download files (unless you already moved it to another location).

After you select the custom visual file, PowerBI should pop up a message stating "The visual was successfully imported into this report."  You can now use it in the report you currently have open.

The new custom Visual will be between the last standard Visual and the ". . ." symbol, as highlighted in yellow, below.
Please keep in mind that for every report where you wish to use a custom visual, it will have to be imported into the current report because PowerBI only keeps the custom visuals linked in the individual reports and not in the application itself. 

For my first experiment with the Hierarchy Slicer, I used the Foodmart.mdb as the data source. I defined a hierarchy in the product_class table (product_family, product_department, product_category, product_subcategory), and set up a report for "Store sales by product hierarchy".

I then added the Hierarchy Slicer to my report and selected the Product Hierarchy for the "fields"

I could then click on various levels of data and observe the filtering of the products change as I made different selections. 

Observations

The Good

  • Easy to use
  • Works great for small hierarchies 
  • Can configure either as "single select" or "multi-select"

The Bad

  • The formatting option to switch the selection from single select to multi-select disappears after the first time the data is filtered, so choose wisely.
  • The hierarchy levels cannot be collapsed, so when working with Date hierarchies, be sure to remove levels below Month from the Hierarchy Slicer otherwise finding dates in the middle of the hierarchy (such as a date 2 years from earliest and 3 years from latest dates) will be extremely challenging. The slicer will also produce an error when loading more than 5 years of dates.

Conclusion

While the Hierarchy slicer is an excellent concept, because it lacks the ability to collapse the hierarchies, I think I'd rather use multiple instances of the standard "Slicer" visual to handle the filtering of the lower level hierarchy choices.


Tuesday, June 14, 2016

Power BI: Custom Visuals - "Meme Generator"

I've been playing with PowerBI recently, and have discovered their Gallery of Custom Visuals. I decided to try some to see what they do and determine whether they'd be useful in future PowerBI projects.

The one that caught my eye first was the "Meme generator". This was clearly created as an exercise in creating a new Visual. It shows that not all of the Visuals necessarily have to be "business ready", just fun or useful in some way. The "Meme Generator" is brilliant in its simplicity. All one can do with it is alter the text at top & bottom and choose the image that links to it.

As you can see to your left, I've tested the Meme Generator with an image of the famous "Steampunk Bacon Cat" embroidery from Urban Threads, a company that produces wildly awesome machine embroidery.

To obtain any of the custom visuals, visit the PowerBI Gallery of Custom Visuals, and click on the one that draws your interest. A dialog box with a description of the custom visual will pop up. The dialog box will also provide a download button and (at least in the case of the Meme Generator) a button to download a sample PowerBI file with examples of the custom visual in use.

After you've downloaded the "Meme Generator" custom visual and its sample file, double-click on the sample file to open it in PowerBI.
The "Meme Generator" custom visual sample file contains three examples of the Meme Generator in use.  If you want to try creating your own Meme, click on the Cat icon (next to the "R" icon as seen below:) 

This will create a "Meme template" for you, which conveniently has instructions for how to configure it.

In the Visualizations section, you will see the options for configuration. 

Change the Top Text & Bottom Text to words appropriate to your Meme, then enter the URL of the image you wish to use for the meme. You may also add a title, change the background, or add a border. You can take a screen shot of the image - I used the "Send to OneNote" screen clipper to select the image then paste it into Paint so I can save it as an image ready to be posted. 


Thursday, June 9, 2016

Better SQL Syntax to Test for Existence Before Dropping


For the longest time, I've been using code like this

IF EXISTS (
    SELECT 1
    FROM sys.objects
    WHERE object_id = OBJECT_ID(N'[dbo].[FakeProc]')
      AND type IN (N'P',N'PC')
    )
  DROP PROCEDURE [dbo].[FakeProc]
GO

IF EXISTS (
     SELECT [name]
     FROM sysobjects
     WHERE [name] = 'trFakeTrigger'
AND type = 'TR'
     )
BEGIN
DROP TRIGGER trFakeTrigger;

END
Go

to test for existence of a Procedure or Trigger prior to dropping it. The challenge inherent within using the above syntax was remembering the abbreviation used to define the object type.

Later on, I found that I could use

IF OBJECT_ID('FakeProc') IS NOT NULL
BEGIN
DROP PROCEDURE FakeProc
END;
GO

IF OBJECT_ID('dbo.fn_FakeFunction') IS NOT NULL
BEGIN
DROP FUNCTION dbo.fn_FakeFunction
END;

GO


This was certainly more memorable than the earlier version but was still not the best choice. I needed a template that could be easily copied multiple times and modified with minimal issues.

I then discovered the most efficient trick: surround the drop command with a TRY - CATCH block.

BEGIN TRY DROP TRIGGER FakeTrigger END TRY BEGIN CATCH END CATCH;

BEGIN TRY DROP TABLE #Test END TRY BEGIN CATCH END CATCH;

BEGIN TRY ALTER TABLE MyTable DROP CONSTRAINT FakeConstraint END TRY BEGIN CATCH END CATCH;

BEGIN TRY DROP PROCEDURE FakeProc END TRY BEGIN CATCH END CATCH;

The best part is that MSDN already has written the code for a TRY-CATCH snippet. This snippet doesn't come built into SSMS, but the page provides clear and simple instructions for creating and importing the snippet. Give it a try and Happy Coding!


Tuesday, April 26, 2016

Power BI Experiments

I’ve recently discovered Power BI. Basically, it’s the child of Power Pivot and SQL Reporting Services, but without Kryptonite to slow it down. You can connect to all kinds of datasources – Excel, SQL, Hadoop, folders ….and 55+ other data sources – and then perform analyses of the data therein. Microsoft has even allowed developers to publish / create new “visualizations” (charts, graphs, maps, etc.) for users to adopt for their data analysis.

I decided to give it a try, and used my Wine Cellar Excel spreadsheet as the test data set so I could more easily recognize any trends that the Visualizations pointed out.

I first evaluated my collection by Country & Region by Quantity of Wine (in ml). The light blue circles correspond to “France”, and the pink is “Portugal”…Somehow Burgundy, France wound up near New York…and our Douro, Portugal (Port!!) sat near the Great Lakes. This I cannot explain.. .I had to edit “Rhone, France” to “Lyon, France” to move it from somewhere in Asia to France. I’m not sure how it was handling the mapping, but I guess it cannot handle Region names.

The only way I could get the mapping to look better was to look up the regions and set them to specific cities in each country. I guess that the mapping program cannot understand Regions (Bordeaux, Burgundy, Cotes D’Or, Willamette Valley, Douro Valley, etc.). Therefore, if one wishes to use Power BI to display data on maps, then the locations listed must be City names, and not Region names, nor a mix of Cities and Regions as I had in my Wine List spreadsheet.

I then tried and analysis of Quantity (in ml) by Year and Appellation. This provided the expected results: we own a LOT of Chateauneuf du Pape 2005 (Pink in below graph).
I also evaluated it using the pie chart to see how that turned out.

Again, it’s obvious what we like to stock in our wine cellar (light blue is all 2005, and the majority is Chateauneuf du Pape), but it also shows that Power BI makes it extremely simple to illustrate that fact through the visualizations it provides - I spend only a few minutes to generate these charts from my data.

All in all, I’d say that Power BI is very useful for quick and efficient analysis of any dataset where a graph or chart would best illustrate the relationship of data elements within it.

Tuesday, April 19, 2016

Mutually INCLUSIVE Sets In SQL

SQL is your best friend when you need to find mutually exclusive sets of data – the more conditions you add to your query, the fewer records are returned. But how do you handle mutually INCLUSIVE sets where you want the content of each group to expand as more criteria are met?

 Most people when faced with a request such as that will respond similar to our Mikos (on the left) – with the “You want what? When?” look.

I had the person requesting this code twice demonstrate how he calculated the mutually inclusive set within Excel before taking on the project so I could be certain I understood the logic he was employing to calculate them.

The first demonstration included some “black magic”. During the second demonstration, I asked him to slow down and explain why he was doing what he did.

Terminology

Essentially, they had a many to many relationship between Project Milestones and Contracts for each Project and they needed to be able to accurately report the revenue for these items.
Normally, there’s a one-to-one or one-to-many relationship between Milestones and Contracts for Projects (at least in the software that I have worked with), so this was to handle the exceptional relationship so they could calculate Project costs and revenue appropriately.
Project – A project – like “build a house”
Project Milestone – Completion of certain tasks for a project – like Painting or Install Carpeting
Contract – the agreement between Customer & the subcontractor doing the work – the painter who also installs carpeting
Reporting Groups – Mutually inclusive sets related to the Milestone & Contract combinations – one reporting group contains all milestones for each Contract as well as all Contracts for each milestone

Algorithm

Determining the correct Reporting Group value is a multi-step process calculated over all Contracts and Milestones associated to the Project.
  1. Sort by Milestone
  2. Assign First-pass group value using DENSE_RANK() OVER (ORDER BY Milestone)
  3. Sort By Contract
  4. For each Contract with multiple Milestones, if the grouping values differ, assign all instances of the grouping value to the lowest value (Example: In Item 16, there are two Milestones. One has Grouping Value 4 & other has Grouping Value 6. Set all Grouping Value 6 instances = 4. Repeat for each Contract where a similar situation exists)
  5. Sort by Grouping Value
  6. Update Grouping Values so that any gaps in the sequence are closed (Example: Grouping Value 6 was removed in an earlier step, so all items with Grouping Value 7 become 6, then all the 8s become 7, etc. so that the Grouping Values are consecutive.)

Code

I found that the only way to reproduce the results was to loop through the data sets similar to the demonstrated method which includes suspiciously redundant code required to produce the “correct-according-to-the-customer” results.
The following may not be ideal SQL, but I found that it returned results exactly matching several examples provided by the Customer. Yes, the seemingly redundant updates are necessary because without them the final output does not match his final results. I have not found any alternative method to replicate the same results more efficiently.
Please note that I’ve simplified the content:
  • Only include what was directly relevant to the calculation of the mutually inclusive data sets
  • The sample dataset that is entered into the @ContractMilestones table is not nearly close to the 100+ line examples given to me
  • I have excluded any direct references to proprietary tables
Please note that the final insert has been commented out since the “FinalReportingGroups” table was not defined in the code, but it exists within the Customer’s database to store the Reporting Groups thus calculated. I’m sure that Readers of this post understand that they only need to view the final results of the calculations since updating the final table would depend upon their own personal database schema.)

    DECLARE @ContractMilestones TABLE (
        Co TINYINT
        ,Project VARCHAR(10)
        ,[Contract] VARCHAR(16)
        ,Milestone VARCHAR(20)
        )
       
INSERT @ContractMilestones (Co, Project, [Contract], Milestone)
VALUES
     ( 102,'Test', '5','493')
    ,( 102,'Test', '1.01','111')
    ,( 102,'Test', '1.01', '211')
    ,( 102,'Test', '1.01', '311')
    ,( 102,'Test', '2.02', '111')
    ,( 102,'Test', '3.01', '211')

    DECLARE @ReportingGroups TABLE (
        Co TINYINT
        ,Project VARCHAR(10)
        ,Milestone VARCHAR(20)
        ,[Contract] VARCHAR(16)
        ,MilestoneRptGroup INT
        ,ContractGrouping INT
        ,FinalGroup INT
        );

    WITH preranked (
        Co
        ,Project
        ,Milestone
        ,[Contract]
        ,MilestoneRptGroup
        )
    AS (
        SELECT Co
            ,Project
            ,Milestone
            ,[Contract]
            ,DENSE_RANK() OVER (
                PARTITION BY Co
                ,Project ORDER BY Co
                    ,Project
                    ,Milestone
                ) AS MilestoneRptGroup
        FROM @ContractMilestones
        )
        ,contractgroupd (
        Co
        ,Project
        ,Milestone
        ,[Contract]
        ,MilestoneRptGroup
        ,ContractGrouping
        )
    AS (
        SELECT Co
            ,Project
            ,Milestone
            ,[Contract]
            ,MilestoneRptGroup
            ,min(MilestoneRptGroup) OVER (
                PARTITION BY [Contract] ORDER BY [Contract] DESC
                ) AS ContractGrouping
        FROM preranked
        )
    INSERT @ReportingGroups (
        Co
        ,Project
        ,Milestone
        ,[Contract]
        ,MilestoneRptGroup
        ,ContractGrouping
        ,FinalGroup
        )
    SELECT Co
        ,Project
        ,Milestone
        ,[Contract]
        ,MilestoneRptGroup
        ,ContractGrouping
        ,DENSE_RANK() OVER (
            ORDER BY Co
                ,Project
                ,ContractGrouping
            ) AS FinalGroup
    FROM contractgroupd
    ORDER BY FinalGroup

    DECLARE @ItemGrouping INT
    DECLARE @MilestoneGroup TABLE (MilestoneRptGroup INT)
    DECLARE @ContractGroup TABLE (ContractRptGroup INT)

    SELECT @ItemGrouping = min(FinalGroup)
    FROM @ReportingGroups

    WHILE @ItemGrouping IS NOT NULL
    BEGIN
        INSERT @MilestoneGroup (MilestoneRptGroup)
        SELECT DISTINCT MilestoneRptGroup
        FROM @ReportingGroups
        WHERE FinalGroup = @ItemGrouping

        UPDATE @ReportingGroups
        SET FinalGroup = @ItemGrouping
            ,MilestoneRptGroup = @ItemGrouping
        WHERE MilestoneRptGroup IN (
                SELECT MilestoneRptGroup
                FROM @MilestoneGroup
                )

        DELETE
        FROM @MilestoneGroup

        INSERT @ContractGroup (ContractRptGroup)
        SELECT DISTINCT ContractGrouping
        FROM @ReportingGroups
        WHERE FinalGroup = @ItemGrouping

        UPDATE @ReportingGroups
        SET FinalGroup = @ItemGrouping
            ,ContractGrouping = @ItemGrouping
        WHERE ContractGrouping IN (
                SELECT ContractRptGroup
                FROM @ContractGroup
                )

        DELETE
        FROM @ContractGroup

        SELECT @ItemGrouping = min(FinalGroup)
        FROM @ReportingGroups
        WHERE FinalGroup > @ItemGrouping
    END;

-- This is the final table that holds the data we've retrieved
-- insert commented out so we can do a simple select.   
  --  INSERT FinalReportingGroups (
  --      Co
  --     ,Project
  --     ,[Contract]
  --     ,ReportingGroup
  --     ,Milestone
  --     )
    SELECT Co
        ,Project
        ,[Contract]
        ,DENSE_RANK() OVER (
            ORDER BY Co
                ,Project
                ,ContractGrouping
            ) AS ReportingGroup
        ,Milestone
    FROM @ReportingGroups
    ORDER BY Co
        ,Project
        ,[Contract]
        ,Milestone


Wednesday, November 13, 2013

Pivoting SQL Data for Instant Reporting

I always get a bit of geeky enjoyment out of finding an excuse to take advantage of features introduced into newer versions of SQL server. Today, a coworker asked me to help him pivot some data from an issue tracking table he was using. He didn’t know what “pivot” was, but that is what he wanted.
Here’s the table with sample data:
CREATE TABLE [dbo].[Issues](
    [Id] [int] IDENTITY(1,1) NOT NULL,
    [WorkItem] [nvarchar](50) NOT NULL,
    [DateSubmitted] [date] NOT NULL,
    [DateFixed] [date] NULL,
PRIMARY KEY CLUSTERED (
    [Id] ASC
)
)

INSERT [dbo].[Issues](
    [WorkItem],
    [DateSubmitted],
    [DateFixed]
)
VALUES
('Test', '20130310', '20130310'),
('Test1', '20130310', NULL),
('Test2', '20130311', '20130313'),
('Test3', '20130311', '20130311'),
('Test4', '20130311', '20130320'),
('Test5', '20130312', '20130314'),
('Test6', '20130314', '20130315'),
('Test7', '20130314', '20130315'),
('Test8', '20130316', '20130319'),
('Test9', '20130319', '20130330'),
('Test10', '20130320', NULL)

He asked me to go through the table, and for each day count how many issues were submitted and how many were fixed. When he manually counted the values, he got the following results:
Date Submitted Fixed
3/10/2013 2 1
3/11/2013 3 1
3/12/2013 1 0
3/13/2013 0 1
3/14/2013 2 1
3/15/2013 0 2
3/16/2013 1 0
3/19/2013 1 1
3/20/2013 1 1
3/30/2013 0 1
After staring at the tables for a few moments, I realized that the easiest way to transform the table into the results was to use PIVOT.
Select [Date]
, ISNULL([Submitted],0) as [Submitted]
, ISNULL([Fixed],0) as [Fixed]
FROM
  (Select DateFixed as [Date], COUNT(Id) as ct, 'Fixed' as md
     from dbo.[Issues]
    where DateFixed is not NULL
group by DateFixed
UNION ALL
   Select DateSubmitted as [Date], COUNT(Id) as ct, 'Submitted' as md
     from dbo.[Issues]
    where DateSubmitted is not NULL
group by DateSubmitted) as SourceTable
PIVOT
  (sum(ct)
   for md in ([Submitted], [Fixed])) as pvt
order by [Date]

And there you go. Fun day with new PIVOT-y toys.

Monday, September 30, 2013

Easy Trace File Query

Whenever a customer has an issue with slowness, we request a trace file to help us figure out where the problem may be. The trace allows us to see which procs are called most often, and which are taking up the most time.

I used to import the trace file into a temporary table, then run my own queries on the file to pinpoint issues. While that works well, it requires me to make additional copies of the customer's data which all has to be tracked due to in-house security rules. Since I don't like having to do excessive paperwork, I found a way to easily read in the data from where it sits rather than importing it into SQL server:

Select ObjectName
, substring(DatabaseName, 1, 18) as dbname
AVG(cpu) as cpuuse
, AVG(reads) as avgreads
, AVG(writes) as avgwrites
, COUNT(EndTime) as instances
, AVG(duration) as avgduration
, COUNT(EndTime) * AVG(reads) as cumexpense
from fn_trace_gettable ('C:\Temp\MyTraceFile.trc', DEFAULT)
group by ObjectName, substring(DatabaseName, 1, 18)
order by avgreads desc

The above query orders the items in the trace by average number of reads. Next, order the list by Average CPU then Average Duration. Any queries that are consistently at the top of the list are the first candidates for tuning.

I've also used the following to zero in on data regarding specific procs:

select  DatabaseName, ObjectName, TextData, CPU, Reads, Writes
from fn_trace_gettable ('C:\Temp\MyTraceFile.trc', DEFAULT)
where ObjectName ='MyStoredProc' or ObjectName='YourStoredProc'

Have fun analyzing your trace files.

Resoved: Error Creating Storage Event Trigger in Azure Synapse

My client receives external files from a vendor and wants to ingest them into the Data Lake using the integration pipelines in Synapse (Syna...