Friday, June 24, 2016

Power BI: Custom Visuals - Hierarchy Slicer

I've been playing with PowerBI recently and have discovered their Gallery of Custom Visuals. I decided to try a few to see what they do and determine whether they'd be useful in future PowerBI projects.

Previously, I tested the "Meme generator" (Note: this visualization has been removed temporarily from the PowerBI website, but should reappear shortly). This time, I've chosen one that I hope to be useful to PowerBI users.

The Hierarchy Slicer is available from the PowerBI Gallery of Custom Visuals. Click on its icon to open up the Description and Download dialog. This dialog also offers the option to download a sample PowerBI file that demonstrates the use of the visual.


Testing

After examining the sample file, I decided to experiment with the new visual on my own.

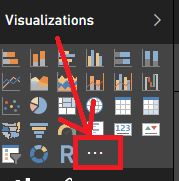
As with all custom visuals, when you open a new PowerBI report, the custom visual is not automatically available in the visuals list. To make it available you must first import it into the Visualizations bar by clicking on the " . . . " icon.

PowerBI will pop up a warning that you're attempting to load a custom visual and that you should only open it if you trust its author and source.
 Click on Import to open a dialog to browse for the custom visual you just downloaded. It should be named, "HierarchySlicer.0.6.0.pbiviz" (or similar - they may have updated it since I downloaded it) and it should be located in the directory where you normally download files (unless you already moved it to another location).

After you select the custom visual file, PowerBI should pop up a message stating "The visual was successfully imported into this report."  You can now use it in the report you currently have open.

The new custom Visual will be between the last standard Visual and the ". . ." symbol, as highlighted in yellow, below.
Please keep in mind that for every report where you wish to use a custom visual, it will have to be imported into the current report because PowerBI only keeps the custom visuals linked in the individual reports and not in the application itself. 

For my first experiment with the Hierarchy Slicer, I used the Foodmart.mdb as the data source. I defined a hierarchy in the product_class table (product_family, product_department, product_category, product_subcategory), and set up a report for "Store sales by product hierarchy".

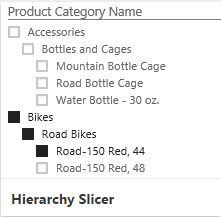
I then added the Hierarchy Slicer to my report and selected the Product Hierarchy for the "fields"

I could then click on various levels of data and observe the filtering of the products change as I made different selections. 

Observations

The Good

  • Easy to use
  • Works great for small hierarchies 
  • Can configure either as "single select" or "multi-select"

The Bad

  • The formatting option to switch the selection from single select to multi-select disappears after the first time the data is filtered, so choose wisely.
  • The hierarchy levels cannot be collapsed, so when working with Date hierarchies, be sure to remove levels below Month from the Hierarchy Slicer otherwise finding dates in the middle of the hierarchy (such as a date 2 years from earliest and 3 years from latest dates) will be extremely challenging. The slicer will also produce an error when loading more than 5 years of dates.

Conclusion

While the Hierarchy slicer is an excellent concept, because it lacks the ability to collapse the hierarchies, I think I'd rather use multiple instances of the standard "Slicer" visual to handle the filtering of the lower level hierarchy choices.


Tuesday, June 14, 2016

Power BI: Custom Visuals - "Meme Generator"

I've been playing with PowerBI recently, and have discovered their Gallery of Custom Visuals. I decided to try some to see what they do and determine whether they'd be useful in future PowerBI projects.

The one that caught my eye first was the "Meme generator". This was clearly created as an exercise in creating a new Visual. It shows that not all of the Visuals necessarily have to be "business ready", just fun or useful in some way. The "Meme Generator" is brilliant in its simplicity. All one can do with it is alter the text at top & bottom and choose the image that links to it.

As you can see to your left, I've tested the Meme Generator with an image of the famous "Steampunk Bacon Cat" embroidery from Urban Threads, a company that produces wildly awesome machine embroidery.

To obtain any of the custom visuals, visit the PowerBI Gallery of Custom Visuals, and click on the one that draws your interest. A dialog box with a description of the custom visual will pop up. The dialog box will also provide a download button and (at least in the case of the Meme Generator) a button to download a sample PowerBI file with examples of the custom visual in use.

After you've downloaded the "Meme Generator" custom visual and its sample file, double-click on the sample file to open it in PowerBI.
The "Meme Generator" custom visual sample file contains three examples of the Meme Generator in use.  If you want to try creating your own Meme, click on the Cat icon (next to the "R" icon as seen below:) 

This will create a "Meme template" for you, which conveniently has instructions for how to configure it.

In the Visualizations section, you will see the options for configuration. 

Change the Top Text & Bottom Text to words appropriate to your Meme, then enter the URL of the image you wish to use for the meme. You may also add a title, change the background, or add a border. You can take a screen shot of the image - I used the "Send to OneNote" screen clipper to select the image then paste it into Paint so I can save it as an image ready to be posted. 


Thursday, June 9, 2016

Better SQL Syntax to Test for Existence Before Dropping


For the longest time, I've been using code like this

IF EXISTS (
    SELECT 1
    FROM sys.objects
    WHERE object_id = OBJECT_ID(N'[dbo].[FakeProc]')
      AND type IN (N'P',N'PC')
    )
  DROP PROCEDURE [dbo].[FakeProc]
GO

IF EXISTS (
     SELECT [name]
     FROM sysobjects
     WHERE [name] = 'trFakeTrigger'
AND type = 'TR'
     )
BEGIN
DROP TRIGGER trFakeTrigger;

END
Go

to test for existence of a Procedure or Trigger prior to dropping it. The challenge inherent within using the above syntax was remembering the abbreviation used to define the object type.

Later on, I found that I could use

IF OBJECT_ID('FakeProc') IS NOT NULL
BEGIN
DROP PROCEDURE FakeProc
END;
GO

IF OBJECT_ID('dbo.fn_FakeFunction') IS NOT NULL
BEGIN
DROP FUNCTION dbo.fn_FakeFunction
END;

GO


This was certainly more memorable than the earlier version but was still not the best choice. I needed a template that could be easily copied multiple times and modified with minimal issues.

I then discovered the most efficient trick: surround the drop command with a TRY - CATCH block.

BEGIN TRY DROP TRIGGER FakeTrigger END TRY BEGIN CATCH END CATCH;

BEGIN TRY DROP TABLE #Test END TRY BEGIN CATCH END CATCH;

BEGIN TRY ALTER TABLE MyTable DROP CONSTRAINT FakeConstraint END TRY BEGIN CATCH END CATCH;

BEGIN TRY DROP PROCEDURE FakeProc END TRY BEGIN CATCH END CATCH;

The best part is that MSDN already has written the code for a TRY-CATCH snippet. This snippet doesn't come built into SSMS, but the page provides clear and simple instructions for creating and importing the snippet. Give it a try and Happy Coding!


Tuesday, April 26, 2016

Power BI Experiments

I’ve recently discovered Power BI. Basically, it’s the child of Power Pivot and SQL Reporting Services, but without Kryptonite to slow it down. You can connect to all kinds of datasources – Excel, SQL, Hadoop, folders ….and 55+ other data sources – and then perform analyses of the data therein. Microsoft has even allowed developers to publish / create new “visualizations” (charts, graphs, maps, etc.) for users to adopt for their data analysis.

I decided to give it a try, and used my Wine Cellar Excel spreadsheet as the test data set so I could more easily recognize any trends that the Visualizations pointed out.

I first evaluated my collection by Country & Region by Quantity of Wine (in ml). The light blue circles correspond to “France”, and the pink is “Portugal”…Somehow Burgundy, France wound up near New York…and our Douro, Portugal (Port!!) sat near the Great Lakes. This I cannot explain.. .I had to edit “Rhone, France” to “Lyon, France” to move it from somewhere in Asia to France. I’m not sure how it was handling the mapping, but I guess it cannot handle Region names.

The only way I could get the mapping to look better was to look up the regions and set them to specific cities in each country. I guess that the mapping program cannot understand Regions (Bordeaux, Burgundy, Cotes D’Or, Willamette Valley, Douro Valley, etc.). Therefore, if one wishes to use Power BI to display data on maps, then the locations listed must be City names, and not Region names, nor a mix of Cities and Regions as I had in my Wine List spreadsheet.

I then tried and analysis of Quantity (in ml) by Year and Appellation. This provided the expected results: we own a LOT of Chateauneuf du Pape 2005 (Pink in below graph).
I also evaluated it using the pie chart to see how that turned out.

Again, it’s obvious what we like to stock in our wine cellar (light blue is all 2005, and the majority is Chateauneuf du Pape), but it also shows that Power BI makes it extremely simple to illustrate that fact through the visualizations it provides - I spend only a few minutes to generate these charts from my data.

All in all, I’d say that Power BI is very useful for quick and efficient analysis of any dataset where a graph or chart would best illustrate the relationship of data elements within it.

Tuesday, April 19, 2016

Mutually INCLUSIVE Sets In SQL

SQL is your best friend when you need to find mutually exclusive sets of data – the more conditions you add to your query, the fewer records are returned. But how do you handle mutually INCLUSIVE sets where you want the content of each group to expand as more criteria are met?

 Most people when faced with a request such as that will respond similar to our Mikos (on the left) – with the “You want what? When?” look.

I had the person requesting this code twice demonstrate how he calculated the mutually inclusive set within Excel before taking on the project so I could be certain I understood the logic he was employing to calculate them.

The first demonstration included some “black magic”. During the second demonstration, I asked him to slow down and explain why he was doing what he did.

Terminology

Essentially, they had a many to many relationship between Project Milestones and Contracts for each Project and they needed to be able to accurately report the revenue for these items.
Normally, there’s a one-to-one or one-to-many relationship between Milestones and Contracts for Projects (at least in the software that I have worked with), so this was to handle the exceptional relationship so they could calculate Project costs and revenue appropriately.
Project – A project – like “build a house”
Project Milestone – Completion of certain tasks for a project – like Painting or Install Carpeting
Contract – the agreement between Customer & the subcontractor doing the work – the painter who also installs carpeting
Reporting Groups – Mutually inclusive sets related to the Milestone & Contract combinations – one reporting group contains all milestones for each Contract as well as all Contracts for each milestone

Algorithm

Determining the correct Reporting Group value is a multi-step process calculated over all Contracts and Milestones associated to the Project.
  1. Sort by Milestone
  2. Assign First-pass group value using DENSE_RANK() OVER (ORDER BY Milestone)
  3. Sort By Contract
  4. For each Contract with multiple Milestones, if the grouping values differ, assign all instances of the grouping value to the lowest value (Example: In Item 16, there are two Milestones. One has Grouping Value 4 & other has Grouping Value 6. Set all Grouping Value 6 instances = 4. Repeat for each Contract where a similar situation exists)
  5. Sort by Grouping Value
  6. Update Grouping Values so that any gaps in the sequence are closed (Example: Grouping Value 6 was removed in an earlier step, so all items with Grouping Value 7 become 6, then all the 8s become 7, etc. so that the Grouping Values are consecutive.)

Code

I found that the only way to reproduce the results was to loop through the data sets similar to the demonstrated method which includes suspiciously redundant code required to produce the “correct-according-to-the-customer” results.
The following may not be ideal SQL, but I found that it returned results exactly matching several examples provided by the Customer. Yes, the seemingly redundant updates are necessary because without them the final output does not match his final results. I have not found any alternative method to replicate the same results more efficiently.
Please note that I’ve simplified the content:
  • Only include what was directly relevant to the calculation of the mutually inclusive data sets
  • The sample dataset that is entered into the @ContractMilestones table is not nearly close to the 100+ line examples given to me
  • I have excluded any direct references to proprietary tables
Please note that the final insert has been commented out since the “FinalReportingGroups” table was not defined in the code, but it exists within the Customer’s database to store the Reporting Groups thus calculated. I’m sure that Readers of this post understand that they only need to view the final results of the calculations since updating the final table would depend upon their own personal database schema.)

    DECLARE @ContractMilestones TABLE (
        Co TINYINT
        ,Project VARCHAR(10)
        ,[Contract] VARCHAR(16)
        ,Milestone VARCHAR(20)
        )
       
INSERT @ContractMilestones (Co, Project, [Contract], Milestone)
VALUES
     ( 102,'Test', '5','493')
    ,( 102,'Test', '1.01','111')
    ,( 102,'Test', '1.01', '211')
    ,( 102,'Test', '1.01', '311')
    ,( 102,'Test', '2.02', '111')
    ,( 102,'Test', '3.01', '211')

    DECLARE @ReportingGroups TABLE (
        Co TINYINT
        ,Project VARCHAR(10)
        ,Milestone VARCHAR(20)
        ,[Contract] VARCHAR(16)
        ,MilestoneRptGroup INT
        ,ContractGrouping INT
        ,FinalGroup INT
        );

    WITH preranked (
        Co
        ,Project
        ,Milestone
        ,[Contract]
        ,MilestoneRptGroup
        )
    AS (
        SELECT Co
            ,Project
            ,Milestone
            ,[Contract]
            ,DENSE_RANK() OVER (
                PARTITION BY Co
                ,Project ORDER BY Co
                    ,Project
                    ,Milestone
                ) AS MilestoneRptGroup
        FROM @ContractMilestones
        )
        ,contractgroupd (
        Co
        ,Project
        ,Milestone
        ,[Contract]
        ,MilestoneRptGroup
        ,ContractGrouping
        )
    AS (
        SELECT Co
            ,Project
            ,Milestone
            ,[Contract]
            ,MilestoneRptGroup
            ,min(MilestoneRptGroup) OVER (
                PARTITION BY [Contract] ORDER BY [Contract] DESC
                ) AS ContractGrouping
        FROM preranked
        )
    INSERT @ReportingGroups (
        Co
        ,Project
        ,Milestone
        ,[Contract]
        ,MilestoneRptGroup
        ,ContractGrouping
        ,FinalGroup
        )
    SELECT Co
        ,Project
        ,Milestone
        ,[Contract]
        ,MilestoneRptGroup
        ,ContractGrouping
        ,DENSE_RANK() OVER (
            ORDER BY Co
                ,Project
                ,ContractGrouping
            ) AS FinalGroup
    FROM contractgroupd
    ORDER BY FinalGroup

    DECLARE @ItemGrouping INT
    DECLARE @MilestoneGroup TABLE (MilestoneRptGroup INT)
    DECLARE @ContractGroup TABLE (ContractRptGroup INT)

    SELECT @ItemGrouping = min(FinalGroup)
    FROM @ReportingGroups

    WHILE @ItemGrouping IS NOT NULL
    BEGIN
        INSERT @MilestoneGroup (MilestoneRptGroup)
        SELECT DISTINCT MilestoneRptGroup
        FROM @ReportingGroups
        WHERE FinalGroup = @ItemGrouping

        UPDATE @ReportingGroups
        SET FinalGroup = @ItemGrouping
            ,MilestoneRptGroup = @ItemGrouping
        WHERE MilestoneRptGroup IN (
                SELECT MilestoneRptGroup
                FROM @MilestoneGroup
                )

        DELETE
        FROM @MilestoneGroup

        INSERT @ContractGroup (ContractRptGroup)
        SELECT DISTINCT ContractGrouping
        FROM @ReportingGroups
        WHERE FinalGroup = @ItemGrouping

        UPDATE @ReportingGroups
        SET FinalGroup = @ItemGrouping
            ,ContractGrouping = @ItemGrouping
        WHERE ContractGrouping IN (
                SELECT ContractRptGroup
                FROM @ContractGroup
                )

        DELETE
        FROM @ContractGroup

        SELECT @ItemGrouping = min(FinalGroup)
        FROM @ReportingGroups
        WHERE FinalGroup > @ItemGrouping
    END;

-- This is the final table that holds the data we've retrieved
-- insert commented out so we can do a simple select.   
  --  INSERT FinalReportingGroups (
  --      Co
  --     ,Project
  --     ,[Contract]
  --     ,ReportingGroup
  --     ,Milestone
  --     )
    SELECT Co
        ,Project
        ,[Contract]
        ,DENSE_RANK() OVER (
            ORDER BY Co
                ,Project
                ,ContractGrouping
            ) AS ReportingGroup
        ,Milestone
    FROM @ReportingGroups
    ORDER BY Co
        ,Project
        ,[Contract]
        ,Milestone


Resoved: Error Creating Storage Event Trigger in Azure Synapse

My client receives external files from a vendor and wants to ingest them into the Data Lake using the integration pipelines in Synapse (Syna...